Linked Data - a short presentation
When John Kellas from Bristol Health Partners asked me to come along to an event they and RSA West were organising and talk about linked data and its benefits I was more than happy to say yes.
The event was a series of “lightning talks” to inspire discussion around the theme “Health, Data and the Public Good”. Here are the slides and notes from the talk:

This is a very short introduction to linked data. If you’ve not heard the term linked data before, that’s OK as I’m not going to go into super-technical detail, if you have heard the term before but only in relation to the 4th and 5th levels of open data, then I need you to put what you’ve heard about it to one side for five minutes.
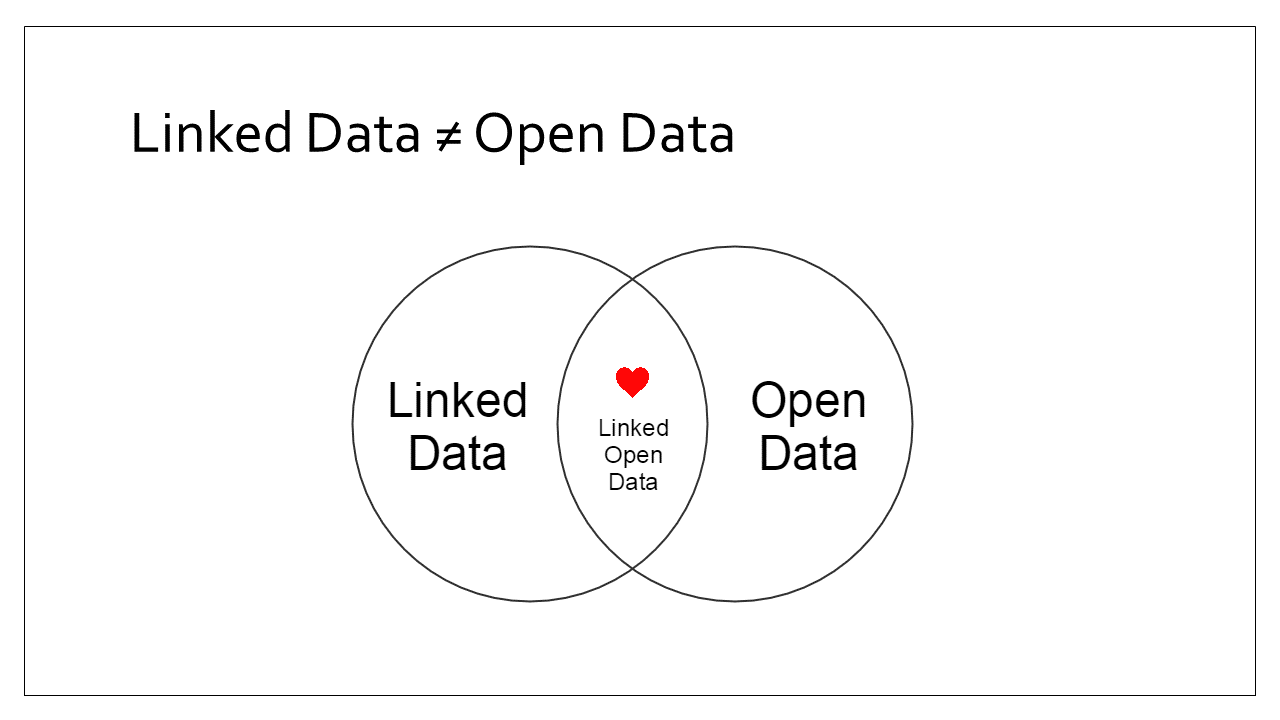
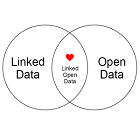
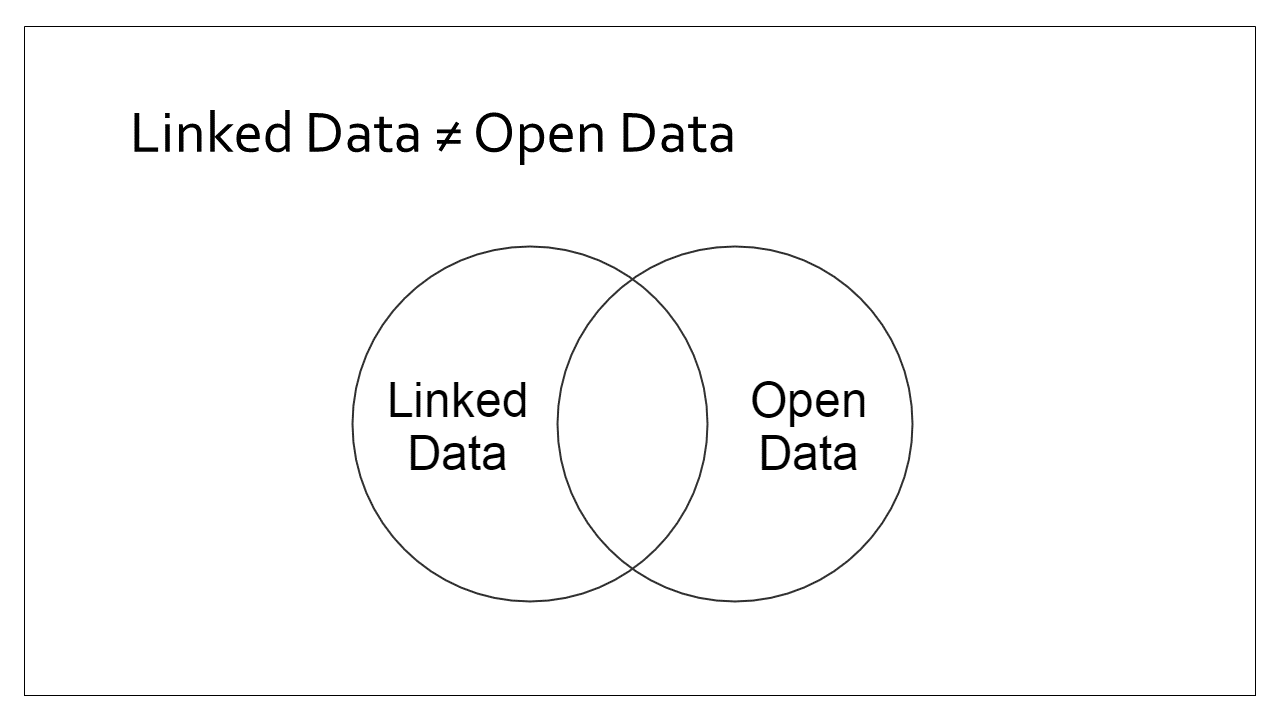
A common mistake is to confuse linked data with open data. Whilst there is a sweet spot in the centre where we published linked data under and open license and it becomes linked open data, they are not one in the same, and one is not a prerequisite of the other.
There are cases where you either not choose to, or should not publish data publicly; for the purpose of this presentation, let’s assume the plan for our data is never to publish it externally. So why would we still be interested in learning about linked data?
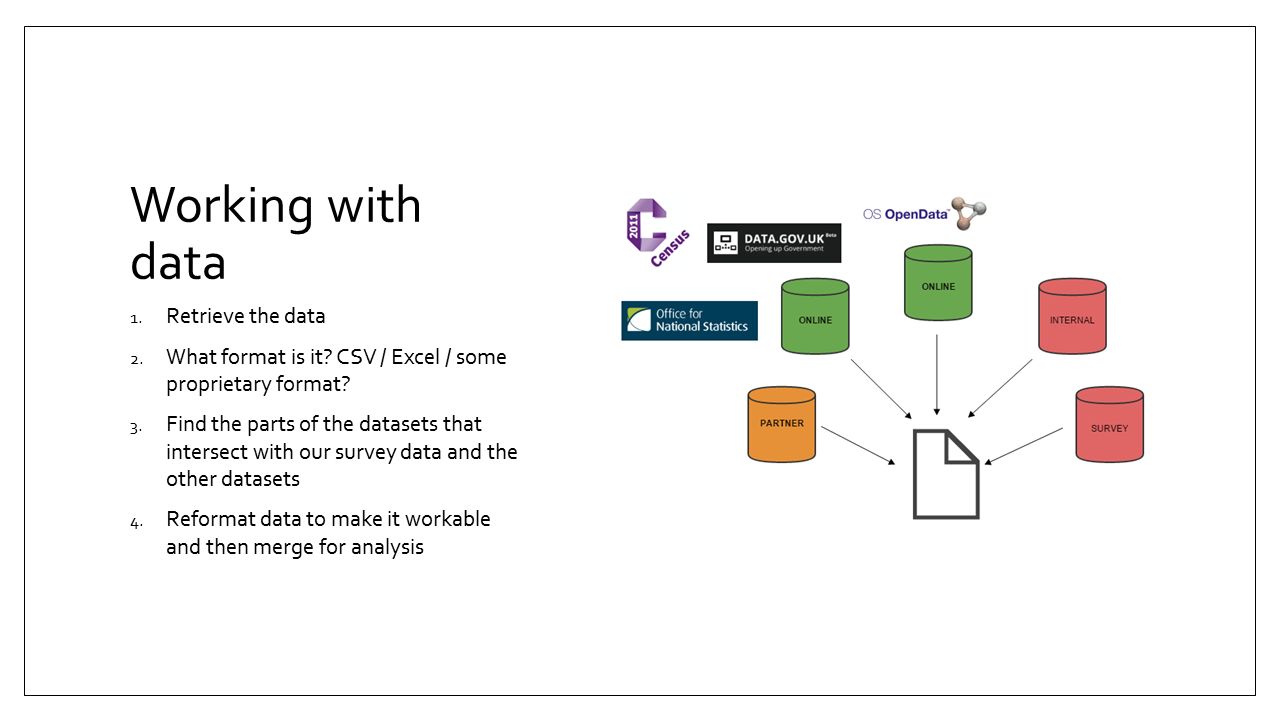
Let’s take an example where we have collected some interesting survey data. Whilst there are some cases where you simply publish a survey’s findings in a report, in almost all cases in order for that report to have impact you will need to compare your collected data with data from both internal and external source.
For example:
- private datasets belonging to your organisation
- open datasets from other organisations
- shared datasets from organisations with which you have data sharing agreements, or pay for a license to access their data
What’s the process? You have to retrieve the data, make sure you can view the data (what format is it in?), see whether there are any places in which the data intersects, and then reformat the data so that those intersections can merge your datasets together. Then you are ready to start analysing the data.
What we need is a way of minimising the amount of time spent on this coordination of datasets, whilst maximising the potential for collaboration.
This is where linked data comes to the rescue!
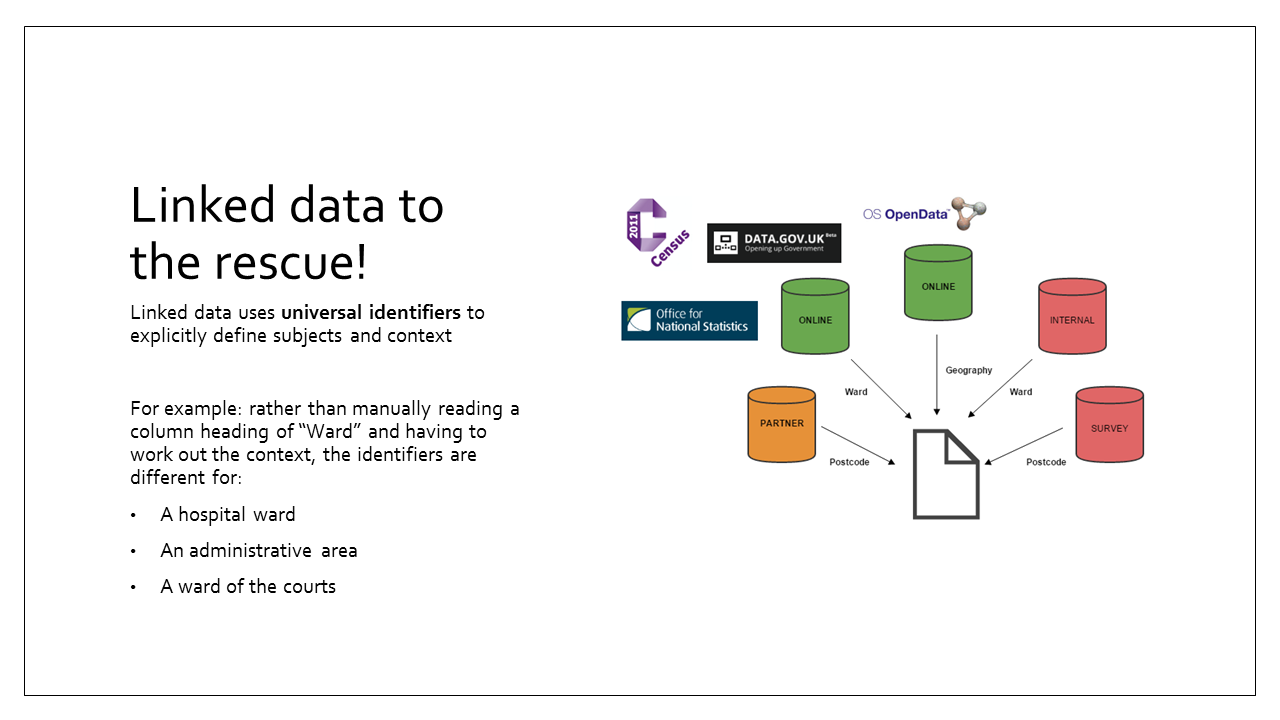
Linked data is the set of standards for structuring data in a way that explicitly defines subjects and context within the raw data itself - not in column headers and not in external documentation or metadata files.
If those datasets (from the earlier slide) each had column headers for “Ward” how do we decide that they have matching meanings? Currently we need to do that process manually, or have extremely complex linguistic programs to try and replicate that work for us.
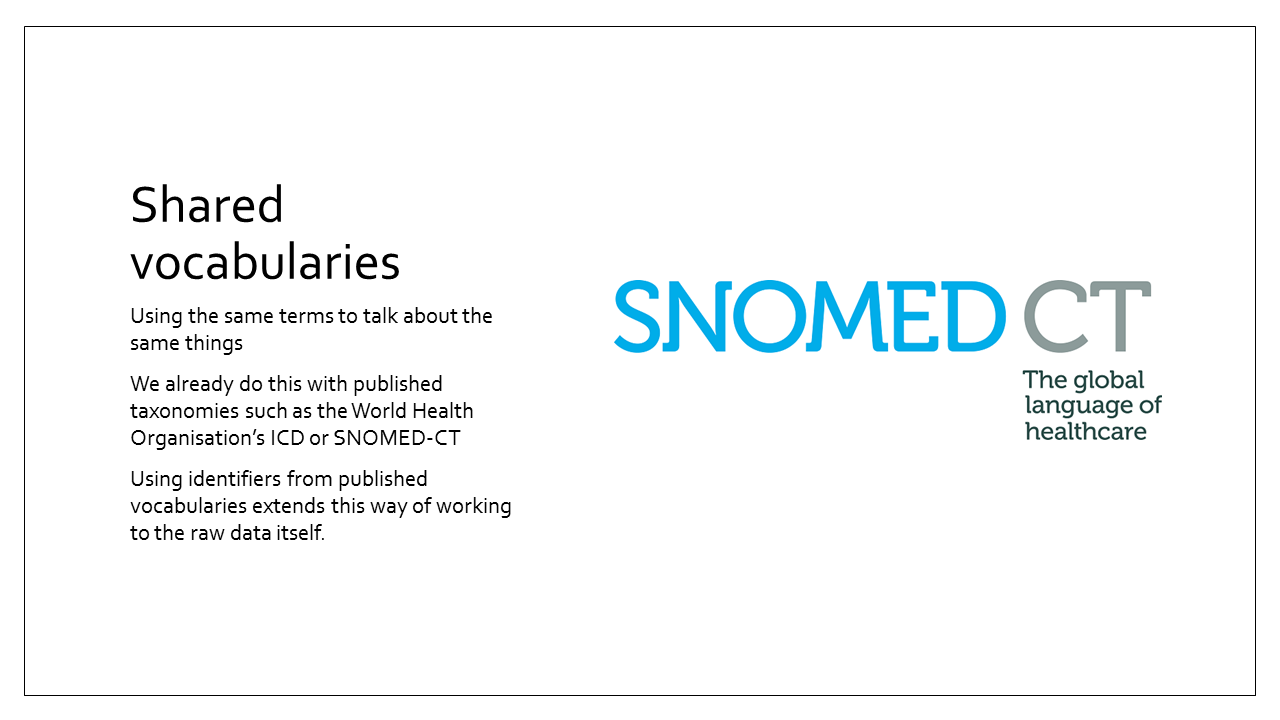
How do we harness this power? - By agreeing to use the same terms when talking about the same concepts in our data.
We already acknowledge that shared taxonomies are a good thing (using SNOMED-CT or ICD classifications for example). Using a common vocabulary for our data extending this principle to data itself so that the properties and types of the things that we are talking about can be more readily understood, not only by people reading it, but also by the machines that process it.
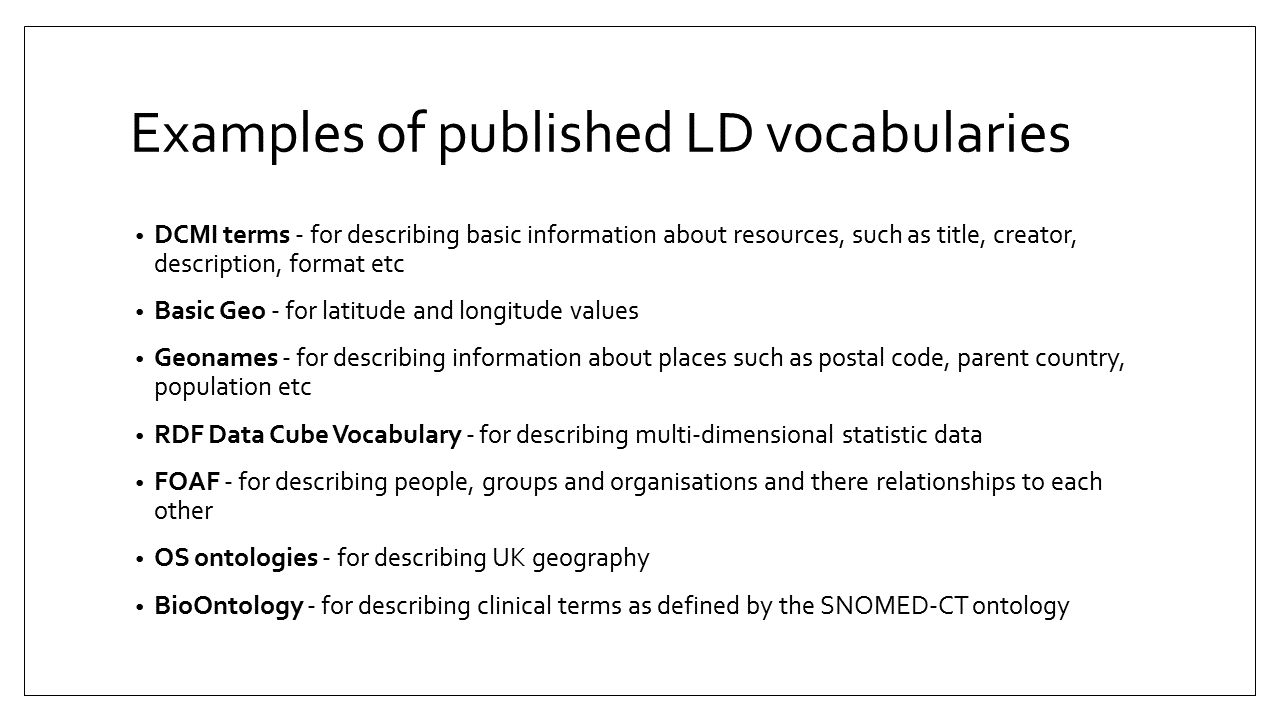
Published shared vocabularies are already out there in use on the Linked Data Web. Such as:
- DCMI for describing basic information about resources, such as title, creator, description, format etc
- Basic Geo for latitude and longitude values
- Geonames for describing information about places such as postal code, parent country, population etc
- RDF Data Cube Vocabulary for describing multi-dimensional statistic data
- FOAF for describing people, groups and organisations and there relationships to each other
- Ordnance Survey ontologies for describing UK geography
- BioOntology for describing clinical terms as defined by the SNOMED-CT ontology
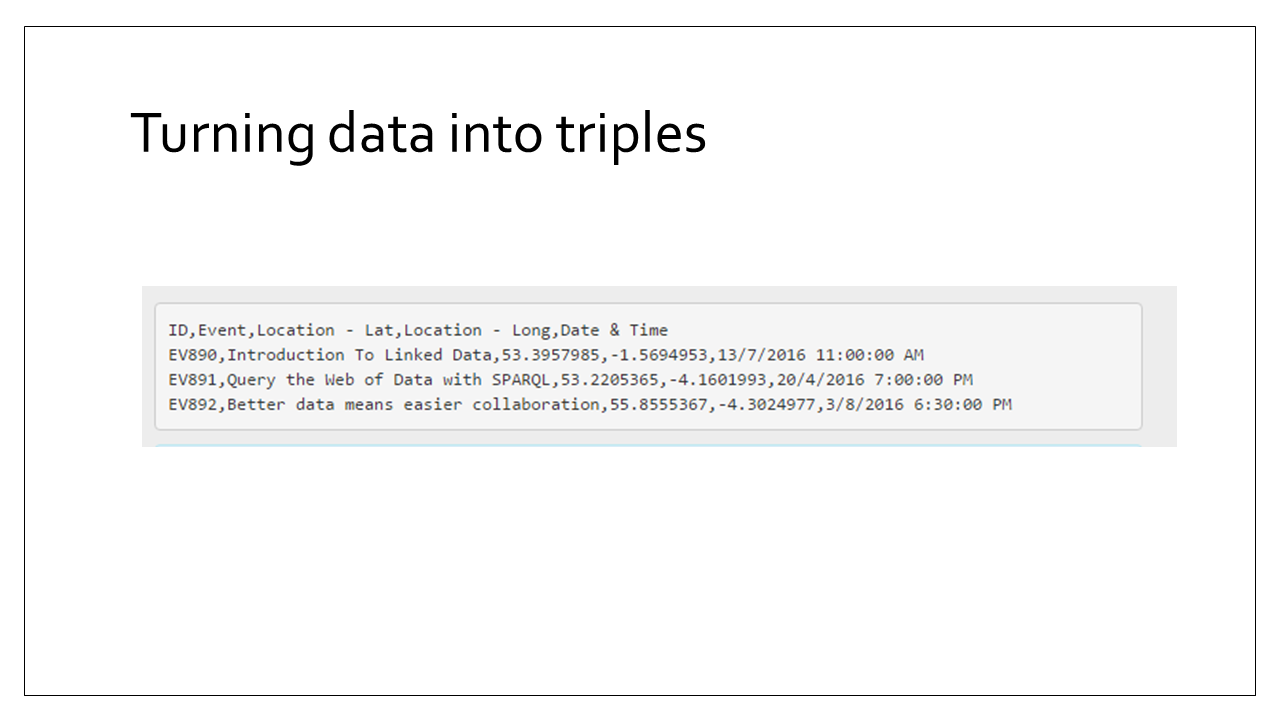
Let’s have a (very) quick look at what linked data can look like in the form of RDF. First we have some simple CSV (Comma Separated Values) tabular data and we’re going to see what that would look like in the form of triples.
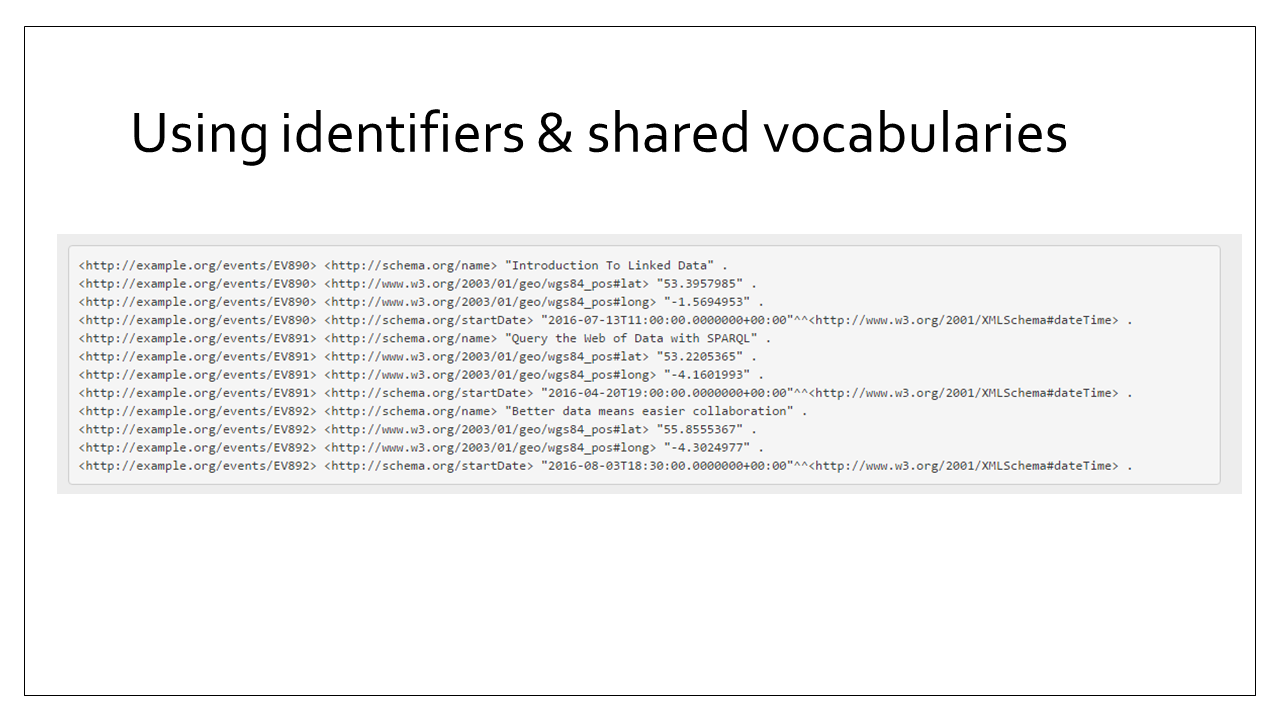
Here we can see that each record/row from that table has been split into a number of “triples” - each triple describes a property of the record/row/resource. As my data from the CSV was about events, I chose to use predicates from the schema.org vocabulary for my event title and date, and I used the Basic Geo Vocab to describe my latitude and longitude values.
There’s not enough time in this introductory talk to go into this further, so do check out our blog on networkedplanet.com where there are some easy to digest “Linked Data 101” posts that talk about these identifiers and predicates and demystify them for you!
The main take-away point here, and it’s a really important one, is that this is not a pie-in-the-sky, “wouldn’t it be nice if…” idea. The Web of Data is out there, and it’s about making use of it to speed up your own processes.
It’s not a magically answer to all your problems but it does let computers take over one part of your data processes. By following open standards in the way you handle and structure your data, you protect yourself from being locked into bespoke software written for you or supplied by vendors who write their own rules which then don’t “fit” with how other people choose to handle data - leaving all this data locked away in silos and all the work on you.
You don’t have to have your entire knowledge domain mapped out in a huge taxonomy to get going. Start small (let project goals guide you in what’s needed now) and adopt an agile approach in iteratively adding to the vocabulary you use for your linked data.
This presentation was given at Bristol Health Partner’s event Health, Data and the Public Good on Monday 22nd February, 2016. If you’d like to learn more about linked data, check out our Linked Data 101 series to get started, or get in touch as we offer training and guidance customised to each organisation’s data needs.