Open data feedback at work!
Whilst finishing off my article on querying linked data, I decided it would be nice to end with something a little more tangible than simply another SPARQL query. I decided a nice map showing the data that I’d converted from CSV to RDF would do the trick.
Whilst it was quick work to display a map using OpenStreetMap tiles and Leaflet.js, something was peculiar - the map markers were nowhere to be seen, and scrolling out found them off the coast of Somalia!
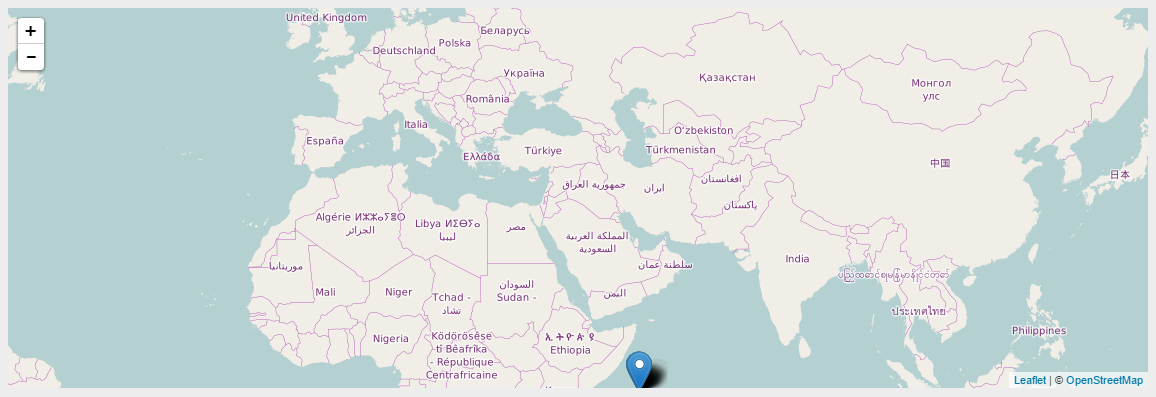
These allotments would have problems with damp
I started tracing back through my steps and found the culprit in the original CSV file - the headings had been mixed up for the longitude and latitude. I headed back to the London Datastore to double check and yes, that was the way in which the data had been published.
Clicking over to their contact page I quickly fired off an e-mail to let them know of the error, and in the matter of a mere 20 minutes I had received an email back saying that the data had been fixed.
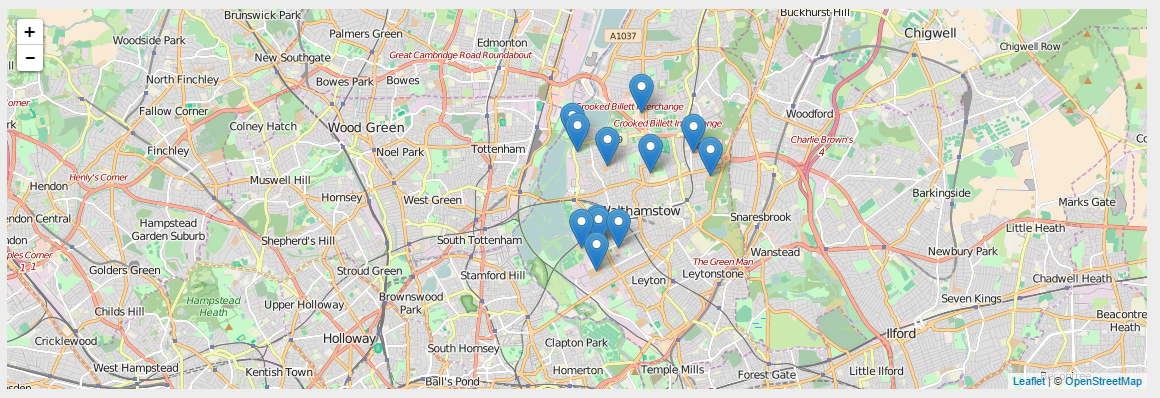
That’s more like it!
It’s very easy to let simple errors slip by, I know what ranges UK latitudes and longitudes should be and I didn’t spot it even though the Level Up converter shows a preview of the original CSV. When working with lots and lots of values it’s easy for things like this to get through and it was the mapping visualisation that made it obvious.
What’s really great is it also shows another benefit of open data, the community aspect of keeping your raw data error-free. Each user of an open dataset has a vested interest in that data being correct. In my case, I wanted it to be able to demonstrate a conversion to RDF, but it could easily be developers or users of an app that use your data in their offerings.
So a massive shout out to @ldn_data for their super fast response in getting the data sorted!

You rock!