Connecting the dots in your data

Before I get stuck into the more technical aspects of DataDock, I’d like to first show a little example of one of the benefits of having a deep-dive data portal, over that of a catalog of datasets. If you’ve not yet read it, have a look at our Introduction to DataDock.
Many data publishing platforms provide a list of the datasets you’ve published. Good ones will include additional information about that dataset (this is known as the metadata). Simplistic catalog offerings, however, can;t display the information from multiple datasets without additional visualisation modules that need to be manually configured to display information from disparate datasets.
By choosing identifiers when you upload data to DataDock, you can upload additional information that pertains to those records later on, and your data portal will automatically group that information together for display in the data portal.
This is best explained in a walk-through of connecting up three datasets I added to my own data portal.
Selecting the data
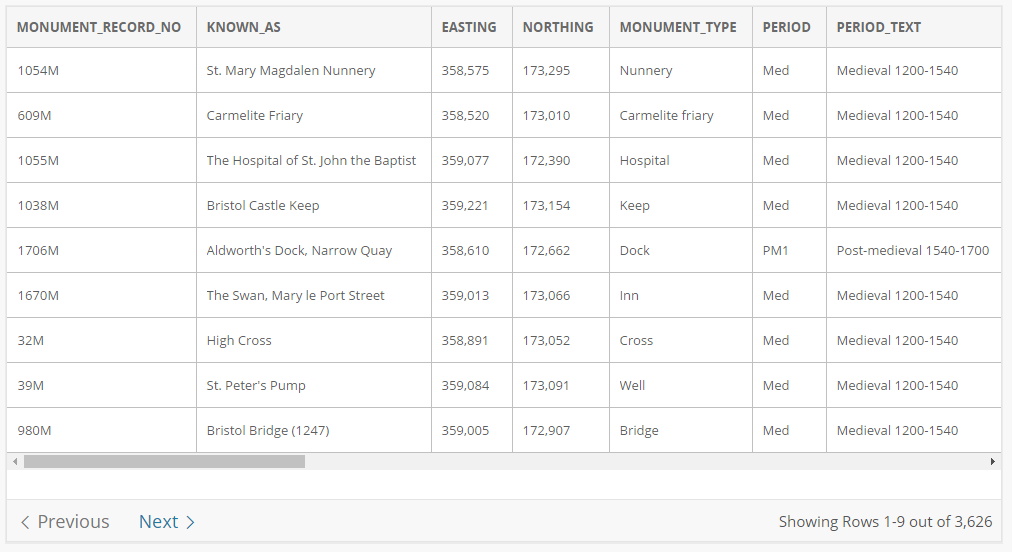
First I went on the hunt for some open data that would be useful to show this functionality. I found an interesting dataset detailing archaeological / historic structures on the Bristol City Council’s beta open data platform. It’s published under a public domain (CC-0) license meaning I have the right to reproduce it elsewhere. The dataset was available in CSV (comma separated value) format and most importantly it also included a Monument Record Number that I quickly checked that there were no duplicates or missing values - perfect for use as the DataDock identifier for each record.
Uploading to DataDock
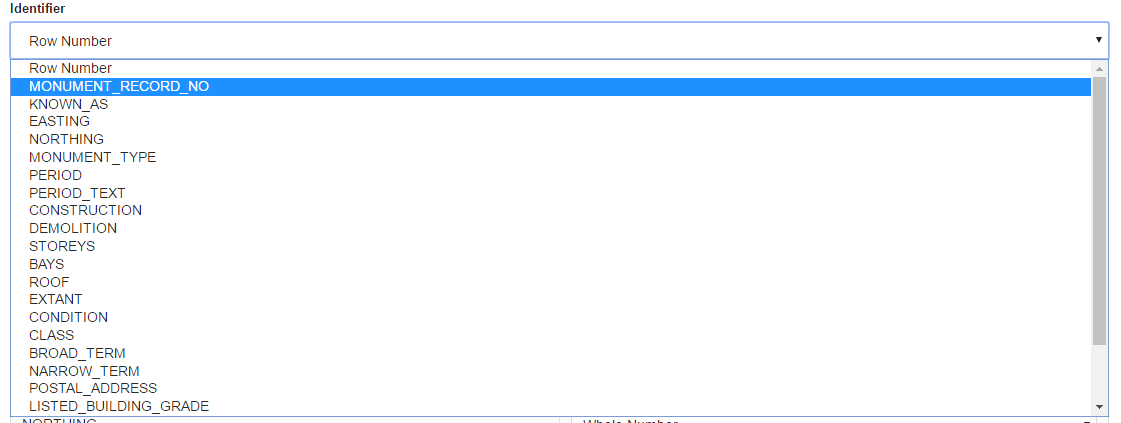
By default, DataDock produces identifiers for each of the records in your spreadsheet using the row number, but to be able to add extra information in the future, we want an identifier that will work across datasets. As mentioned above, I’d seen that the MONUMENT_RECORD_NO suited an identifier and so I selected this from the drop-down list.
Viewing the data
Once the import job was completed, I can use the buttons on my dashboard to view my data portal, and dive into the data using the exampleResource links. See how the fact I selected the Monument Record Number has affected the addresses of the records in the data:
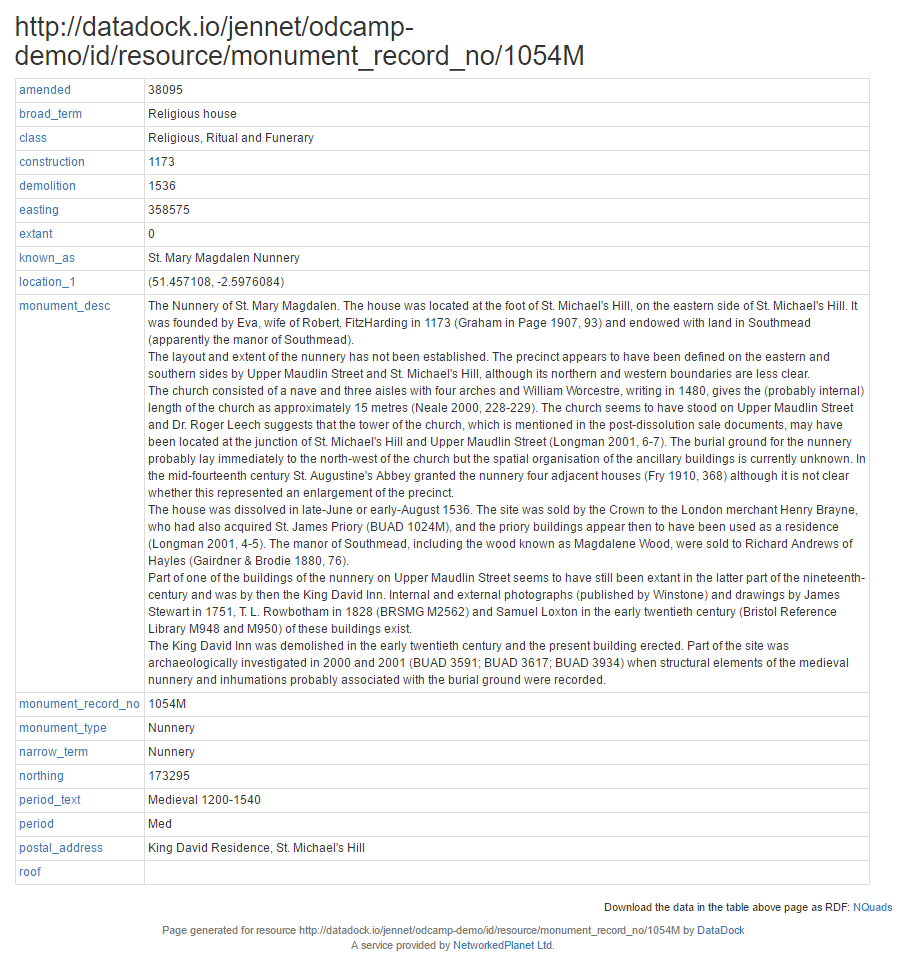
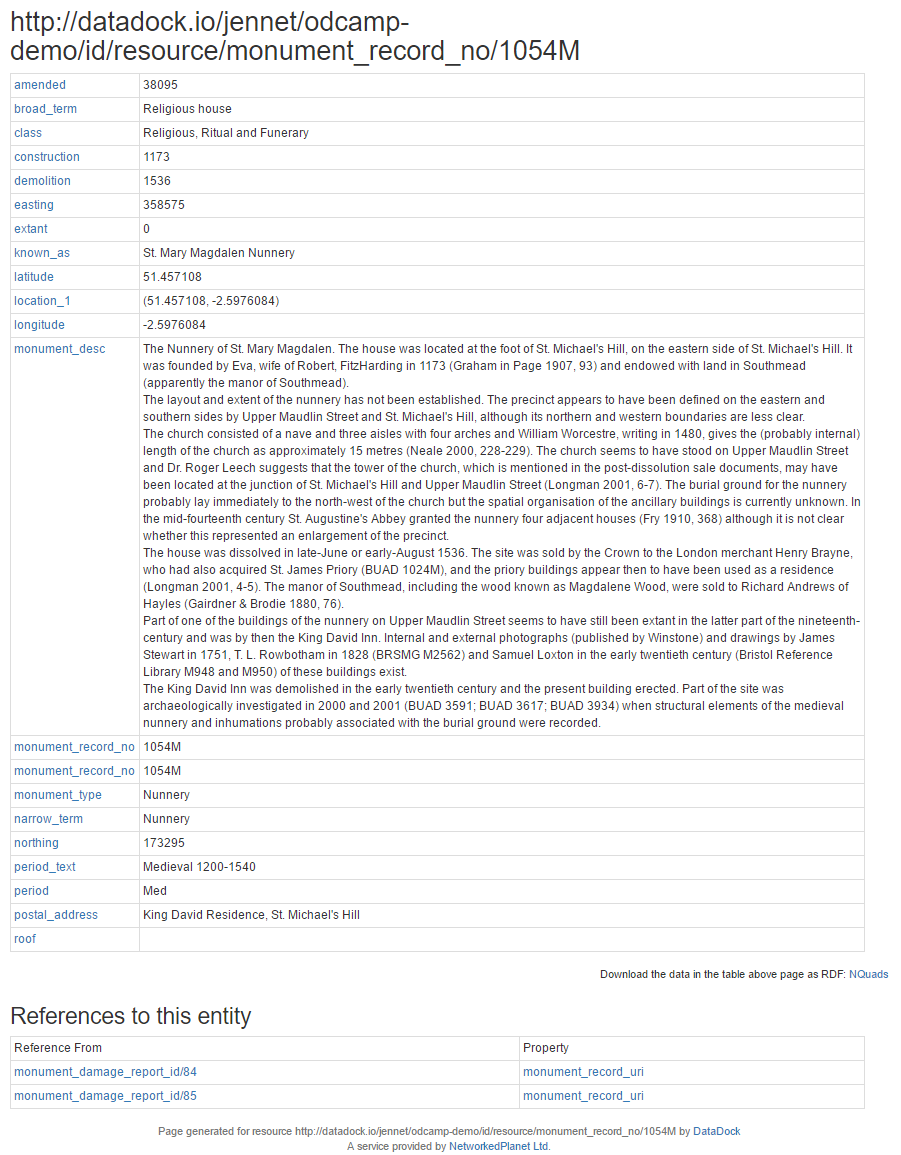
http://datadock.io/jennet/odcamp-demo/id/resource/monument_record_no/1054M
Navigating to this record in a web browser shows us all the information pertaining to that record. This is known as the “resource page” for a particular record in your dataset.
Merging data from a different dataset
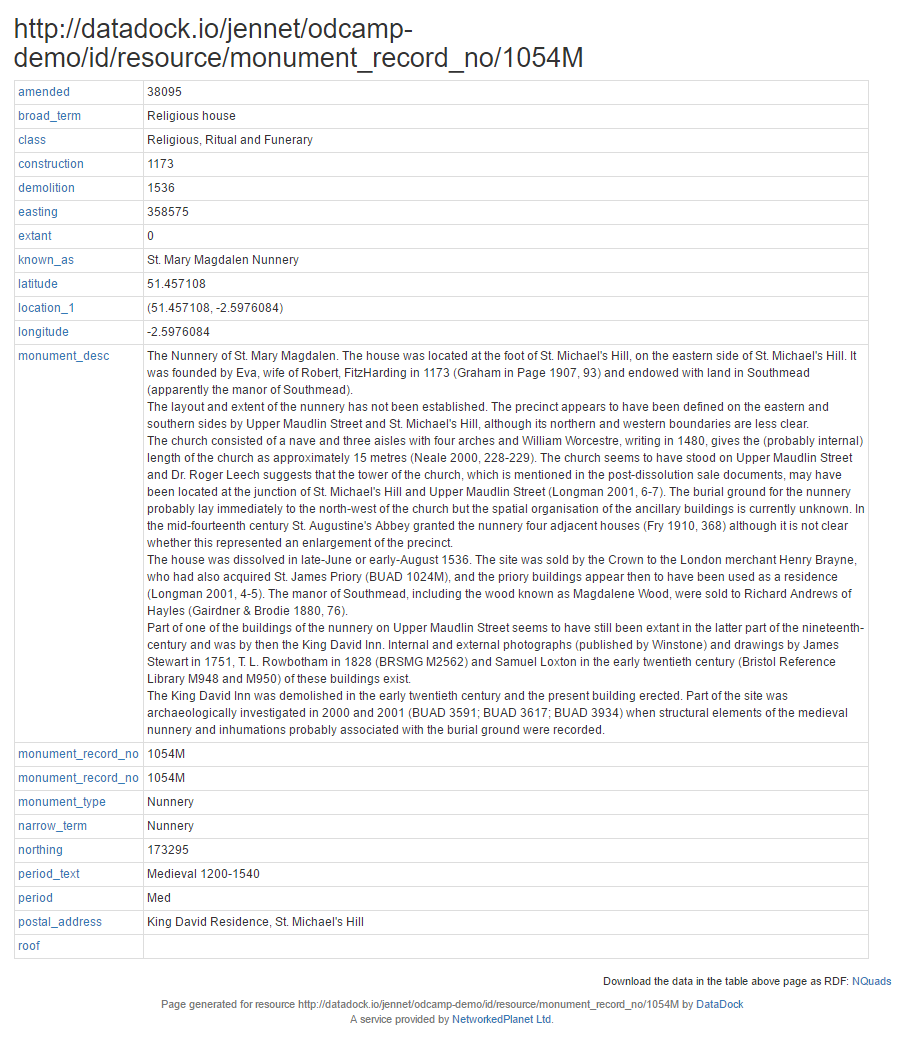
I had a second spreadsheet that contained the specific latitude and longitude of each monument, along with the monument record number of course. I wanted to add this data as the original data only listed the location as a combined field of (lat, long).
During the upload of the second spreadsheet I again selected the MONUMENT_RECORD_NO as my DataDock identifier. Once the import job had completed I can refresh the resource page and see that my additional data from the separate dataset is shown on the same page.
Connecting the dots - linking in
We can also use those same identifiers to link into the resources that we’ve published through other datasets. To demonstrate this I wrote a dummy survey report noting “damage” to the monuments. In the survey data we use the addresses of the monument resources instead of their number or name.
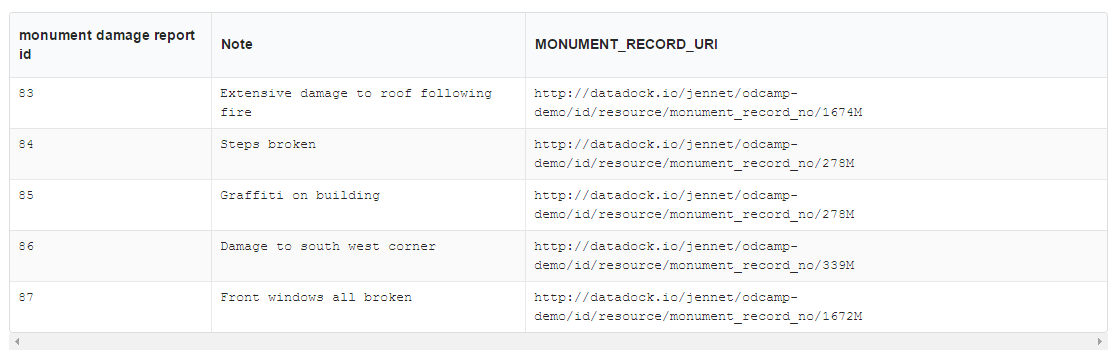
This time I choose the damage report ID as my identifier, and upload the dataset for conversion and publishing.
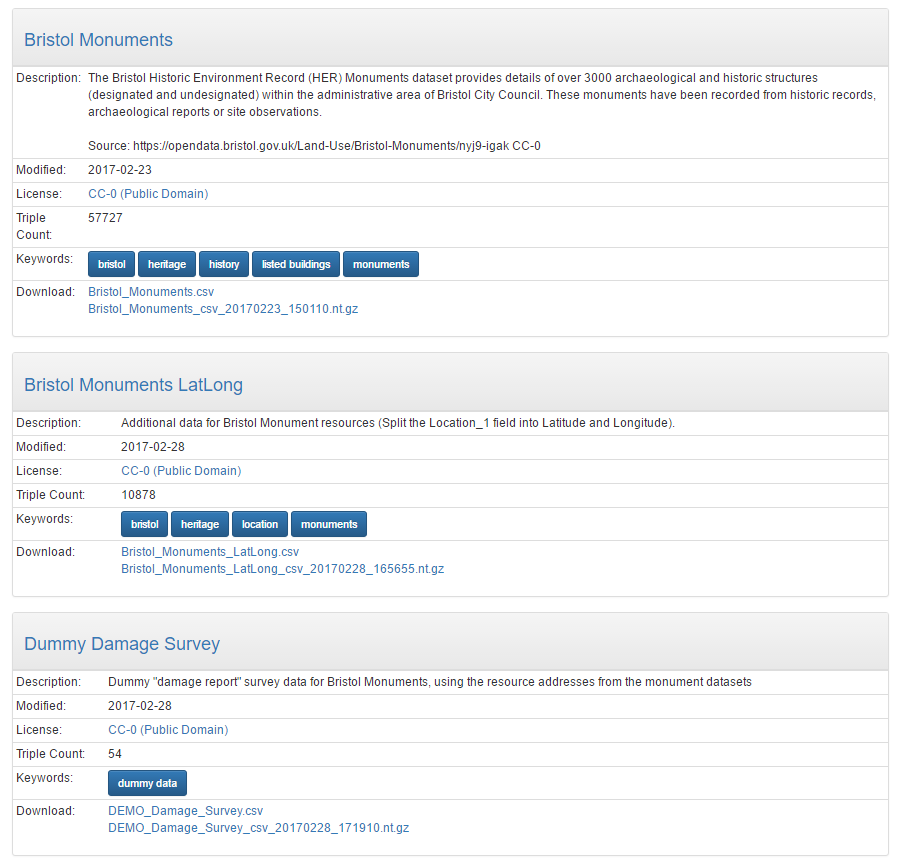
Data catalog
Throughout this process this has also meant that each dataset has been added to the dataset catalog on my data portal landing page. The data catalog lists each of my datasets along with any other information I added during upload, such as the license, a title, description, and keyword tags. It also shows the data download links for the complete dataset.
But more interesting is how the data from these separate datasets can appear in a single web resource through the use of identifiers and we can see how even data that points to the resource can be shown on that resource page too.
I hope you’ve found this simple walkthrough helpful in demonstrating the benefits of being able to connect your data. We’re able to explore data in a way that goes beyond the boundaries of each separate dataset or spreadsheet is their source. Identifiers are the key concept in this way of thinking about connecting data. If you’re interested in having a play around, head on over to DataDock.io and check it out.
This article is part of the Data Dock Intro series