Level Up Your Data!

There is a lot of buzz around the term “open data” at the moment, and rightly so! As more and more organisations open up their data, it builds a data-ecosystem of creative opportunities that are simply not possible when said data is locked away in private silos. There are more and more cases being highlighted that show the power of open data, even more fantastic when you realise that the stories you hear about will only ever be a fraction of what is really using open data - data, by its very nature, is a behind-the-scenes kind of deal, and you most likely make use of it every data without being aware of it.
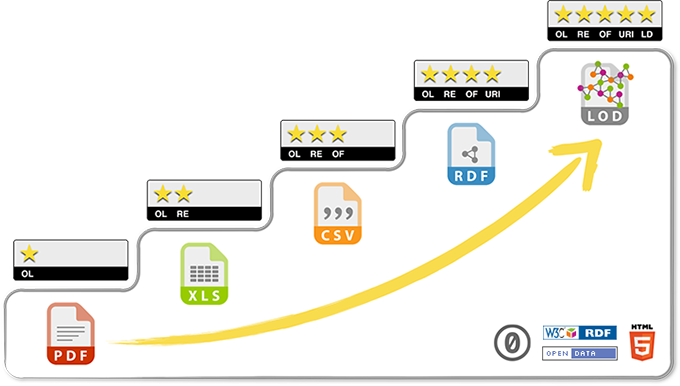
If you’ve been reading about open data you’ve most likely heard of Sir Tim Berners-Lee’s deployment scheme for open data. In short, any data you release on the web under an open license is open data - anything! But it’s easy to see that whilst a PDF report released as open data might be useful for someone to read, it’s going to make someone’s job a LOT tougher if they want to build on the data contained within it in any useful way.
The differences between the subsequent levels follows exactly the same reasoning - an excel spreadsheet is a more structured way of presenting the data of the PDF report, which makes it more re-usable by the people who come to reuse it, but we’re still dealing with a propriatary format. The obvious next step is to convert that data to a non-propriatary format of structured data like CSV. Now you raw data on the web in a format that everyone can use - and we arrive at 3 star open data.

Hang on, doesn’t this show 5 levels of open data?
Why yes! Yes it does! In the same way that CSV is by far an easier format to work with data than PDF, linked open data is another two steps “easier” to work with by formatting it as semantic data rather. What do I mean by semantic data? Well, instead of having tables and rows of values (that require a human to “know” what the table represents), we instead structure that data in a way that demonstrates that each of those records is a “Thing”; that Thing has a bunch of properties (such as length, name, colour, author - anything) and we follow the convention of each Thing having an identifier that is a URI. When you structure your data in this way it is luscious 4 star data, and if you choose to publish it under an open license and link those Things to other Things - wooo! 5 star open data!
You lost me at “semantic”
Ah yes, well, you’re not alone! Many people find it a difficult concept to grasp, I suspect this is one of the major reasons why so many organisations that publish open data find themselves stuck at the 3-star level. Whilst it can feel like a big difference, the actual work taken to Level Up from 3-star to 4-star (and thereby making it possible to reach 5-star) is actually very small. By far the largest chunk of work in any data publishing process is to clean the initial data and structure it well so that it can be published - this must be done even with CSV files (no one thanks you for “data fly tipping”). The bulk of the work is already done - a very small step is all that’s needed to take that CSV and make it delicious, addressable, RDF goodness.
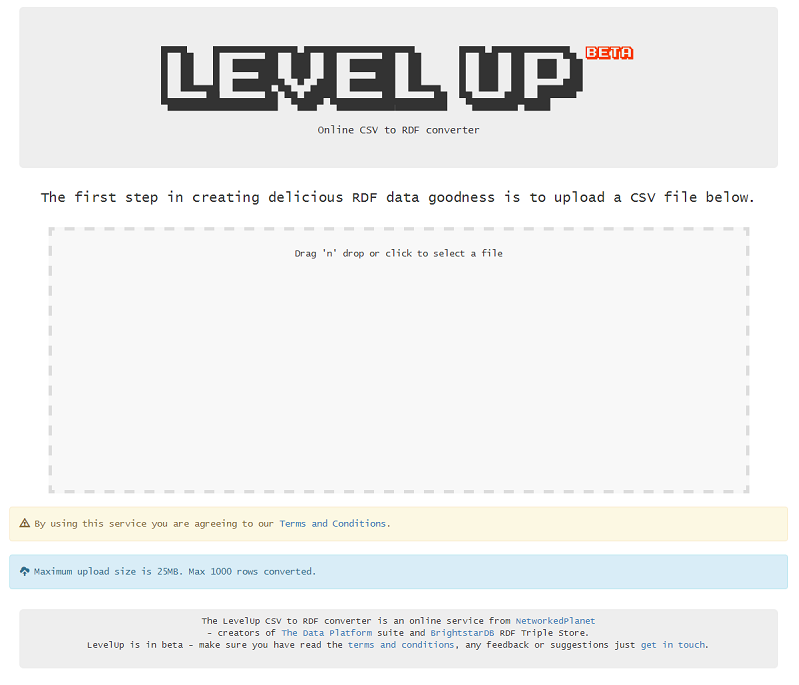
Here at NetworkedPlanet we’ve been working with companies to semantically empower their data for over ten years, so we have learnt a few things along the way! One of which is that if you can see a way of future-proofing your tech development, and it’s within your means to do so, then do it! After chatting with people about linked data a pattern emerged and I noticed that people were getting bogged down in the psychology of semantic information architecture, and missed how simple the difference between CSV and RDF really is. So we wrote an online converter to show you all how to get going:

It’s super simple - just drag and drop a CSV file (make note of the filesize limits!) or click to select a file for conversion. This uploads the file to our server (do read the terms and conditions!) and loads up the mapping page.

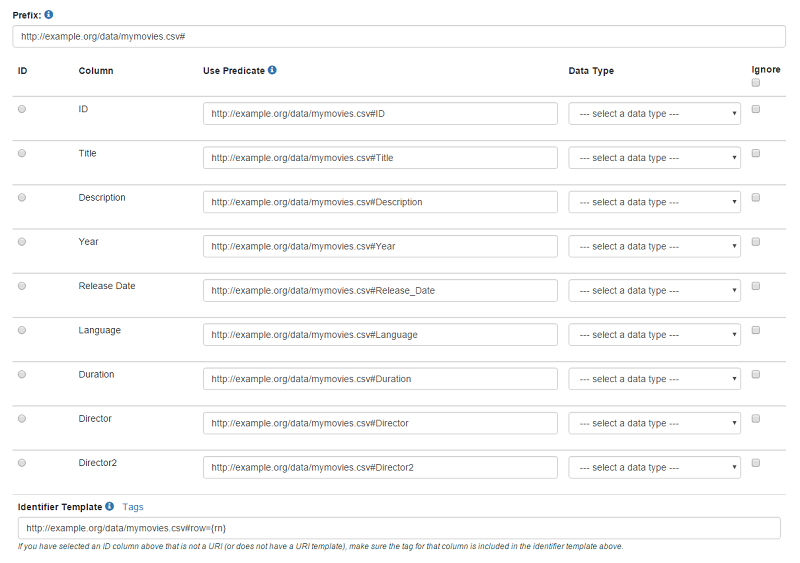
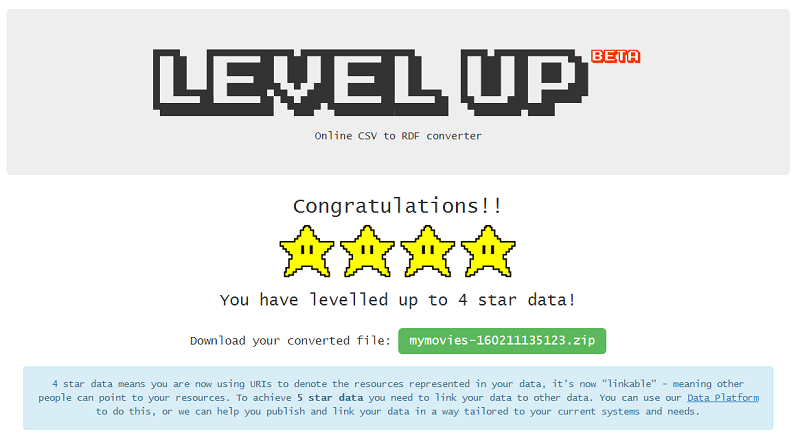
This consists of showing you each of your CSV columns, with controls where you can select what data-types the column values are, or modify the URIs used as predicates, and so on. Don’t worry if you’re not sure what predicates are - we have webinars and blog posts about that coming up if you want to understand linked open data. For your first go, just leave all the defaults in, hit Convert, and download the resulting zip file that contains your 4-star data in different formats.

From there you can have a play around with the converter to make your output even more pretty. Got some latitude and longitude values in your columns? Why not make use of the W3C Basic Geo vocab instead of the automagically created predicates? Set your datatypes so that numbers, dates and text in particular languages are specified as such in the output. Got a code for a resource over on another linked data portal? Use a URI template to turn the code into a valid link to that item - this is not just data on the web, this is data in the web.